While setting up my Active directory lab, I forgot to rename the name on domain controller. You can use this procedure to rename domain controller name. Here I am going to use NETDOM command line utility. Although you can rename it through graphical user interface by using the System Properties but that is not recommended method by Microsoft. Open Powershell (Run as administrator) on the domain controller where you want to change the hostname. Here for demo purpose I have ran below command to check how many domain controllers I have.
Get-ADDomain | Select ReplicaDirectoryServers
And the next command is $env:COMPUTERNAME shows what is the current name is. This way I can ensure I am renaming correct host.
Once you verify that you are on correct domain controller, below command i have run to add new domain controller name
netdom computername WIN-BDUEMS81I1N /add:AD002
WIN-BDUEMS81I1N is my existing host name which i want to change to AD002.
It will ask for confirmation proceed pressing Y. once command is successful fire next command. this command will make AD002 as primary name.
netdom computername WIN-BDUEMS81I1N /makeprimary:AD002 Once the command executed successfully restart computer. After reboot check the system properties or run hostname command in command prompt to verify that server name has been changed correctly.
And below is the final command to remove old server name. Netdom computername AD002 /makeprimary:WIN-BDUEMS81I1N Troubleshooting and Verification To verify everything is successful I check nslookup for the server from desktop in the vcloud.lab domain.
I got failure message. after checking in DNS server I still found the old entry. at this point just restart server once to get the name register in DNS correctly if this doesn't resolve the issue. Add primary DNS suffix in system properties > Computer Name > Change > More. and restart server once.
This should resolve your issue. incase if you are still getting nslookup error. check if old computer entry is still present in DNS if yes then remove it and add this domain controller's entry.
Deleting old entry.
Adding new entry for AD002.
Once you get this successful, check AD related entries in DNS whether they are reflecting new name correctly.
Next step is to check replication and DCDIAG for any errors, I checked repadmin /replsum to see summary of replication and it was successful.
While checking dcdiag I got below failure messages and i will be correcting those in next blog DCDIag - failed test DFSREvent.
Starting test: DFSREvent There are warning or error events within the last 24 hours after the SYSVOL has been shared. Failing SYSVOL replication problems may cause Group Policy problems. ......................... AD002 failed test DFSREvent
CPU is one of the most critical resource in ESXi and if vCPUs on VMs are not configured correctly (over sized) or , it causes lower performance. To rectify any performance related issues you can always check one of the metric - CPU ready value. (Personally I have observed sometimes Storage or Network latency can be caused by higher CPU ready value)
When VM requires CPU time and physical CPU is busy serving other VMs request. VM has to wait for CPU time, It causes in CPU ready time increment. if values goes around or beyond 5 you have to look into it.
Here I have made this small video example to tried make other understandable how Esxi with busy VMs (vCPU) can degrade performance and increment in CPU ready value.
If you CPU ready value is going above value 5 then its time to take some actions. Below powercli script pulls information from performance tab and convert CPU ready summation value into TOP ready%
  #####################################
  ## http://kunaludapi.blogspot.com
  ## Version: 1
  ## Tested this script on successfully
  ## 1) Powershell v3
  ## 2) Windows 7
  ## 3) vSphere 5.1 (vcenter, esxi, powercli)
  #####################################
function Get-Ready {
   <#
   .SYNOPSIS
   This single function provide multiple reports and information. ie: convert ready value to readable format (for realtime, day, week, month, year).
   .DESCRIPTION
   This single function provides multiple information from esxi host, as list below,
   VM's CPU usage, CPU usage Mhz, CPU ready
   vCPU allocated to VM (breaked into Sockets and Core)
   VMHost Name
   Physical CPU information of VMhost (breaked into Sockets and Core)
   To convert between the CPU ready summation value in vCenter's performance charts and the CPU ready % value that you see in esxtop, you must use a formula.
   The formula requires you to know the default update intervals for the performance charts. These are the default update intervals for each chart:
   Realtime: 20 seconds
   Past Day: 5 minutes (300 seconds)
   Past Week: 30 minutes (1800 seconds)
   Past Month: 2 hours (7200 seconds)
   Past Year: 1 day (86400 seconds)
   To calculate the CPU ready % from the CPU ready summation value, use this formula:
   (CPU summation value / (<chart default update interval in seconds> * 1000)) * 100 = CPU ready %
   Example: The Realtime stats for a virtual machine in vCenter might have an average CPU ready summation value of 1000. Use the appropriate values with the formula to get the CPU ready %.
   (1000 / (20s * 1000)) * 100 = 5% CPU ready
   For more infor check on vmware KB 2002181
   .PARAMETER VM
   Virtual machine name
   .INPUTS
   String.System.Management.Automation.PSObject.
   .OUTPUTS
   None.
   .EXAMPLE
   PS>Get-VMHost esxihost.fqdn | Get-Ready
   If you wrap this script inside function you can use it as a command. For more information on using this script check http://kunaludapi.blogspot.com
   Retrive report for vm from perticular VMHost
   .NOTES
   To see the examples, type: "get-help Set-VMHostSSH -examples".
   For more information, type: "get-help Set-VMHostSSH -detailed".
   For technical information, type: "get-help Set-VMHostSSH -full".
   #>
   [CmdletBinding()]
   param(
   [Parameter(Mandatory=$true,ValueFromPipeline=$True,ValueFromPipelineByPropertyName=$true)]
   [String]$Name) #param
   begin {Add-PSSnapin vmware.vimautomation.core}#begin
   process {
     $Stattypes = "cpu.usage.average", "cpu.usagemhz.average", "cpu.ready.summation"
     foreach ($esxi in $(Get-VMHost $Name)) {
       $vmlist = $esxi | Get-VM | Where-Object {$_.PowerState -eq "PoweredOn"}
       $esxiCPUSockets = $esxi.ExtensionData.Summary.Hardware.NumCpuPkgs
       $esxiCPUcores = $esxi.ExtensionData.Summary.Hardware.NumCpuCores/$esxiCPUSockets
       $TotalesxiCPUs = $esxiCPUSockets * $esxiCPUcores
       foreach ($vm in $vmlist) {
         $VMCPUNumCpu = $vm.NumCpu
         $VMCPUCores = $vm.ExtensionData.config.hardware.NumCoresPerSocket
         $VMCPUSockets = $VMCPUNumCpu / $VMCPUCores
         $GroupedRealTimestats = Get-Stat -Entity $vm -Stat $Stattypes -Realtime -Instance "" -ErrorAction SilentlyContinue | Group-Object MetricId
         $RealTimeCPUAverageStat = "{0:N2}" -f $($GroupedRealTimestats | Where {$_.Name -eq "cpu.usage.average"} | Select-Object -ExpandProperty Group | Measure-Object -Average Value | Select-Object -ExpandProperty Average)
         $RealTimeCPUUsageMhzStat = "{0:N2}" -f $($GroupedRealTimestats | Where {$_.Name -eq "cpu.usagemhz.average"} | Select-Object -ExpandProperty Group | Measure-Object -Average Value | Select-Object -ExpandProperty Average)
         $RealTimeReadystat = $GroupedRealTimestats | Where {$_.Name -eq "cpu.ready.summation"} | Select-Object -ExpandProperty Group | Measure-Object -Average Value | Select-Object -ExpandProperty Average
         $RealTimereadyvalue = [math]::Round($(($RealTimeReadystat / (20 * 1000)) * 100), 2)
         $Groupeddaystats = Get-Stat -Entity $vm -Stat $Stattypes -Start (get-date).AddDays(-1) -Finish (get-date) -IntervalMins 5 -Instance "" -ErrorAction SilentlyContinue | Group-Object MetricId
         $dayCPUAverageStat = "{0:N2}" -f $($Groupeddaystats | Where {$_.Name -eq "cpu.usage.average"} | Select-Object -ExpandProperty Group | Measure-Object -Average Value | Select-Object -ExpandProperty Average)
         $dayCPUUsageMhzStat = "{0:N2}" -f $($Groupeddaystats | Where {$_.Name -eq "cpu.usagemhz.average"} | Select-Object -ExpandProperty Group | Measure-Object -Average Value | Select-Object -ExpandProperty Average)
         $dayReadystat = $Groupeddaystats | Where {$_.Name -eq "cpu.ready.summation"} | Select-Object -ExpandProperty Group | Measure-Object -Average Value | Select-Object -ExpandProperty Average
         $dayreadyvalue = [math]::Round($(($dayReadystat / (300 * 1000)) * 100), 2)
         $Groupedweekstats = Get-Stat -Entity $vm -Stat $Stattypes -Start (get-date).AddDays(-7) -Finish (get-date) -IntervalMins 30 -Instance "" -ErrorAction SilentlyContinue | Group-Object MetricId
         $weekCPUAverageStat = "{0:N2}" -f $($Groupedweekstats | Where {$_.Name -eq "cpu.usage.average"} | Select-Object -ExpandProperty Group | Measure-Object -Average Value | Select-Object -ExpandProperty Average)
         $weekCPUUsageMhzStat = "{0:N2}" -f $($Groupedweekstats | Where {$_.Name -eq "cpu.usagemhz.average"} | Select-Object -ExpandProperty Group | Measure-Object -Average Value | Select-Object -ExpandProperty Average)
         $weekReadystat = $Groupedweekstats | Where {$_.Name -eq "cpu.ready.summation"} | Select-Object -ExpandProperty Group | Measure-Object -Average Value | Select-Object -ExpandProperty Average
         $weekreadyvalue = [math]::Round($(($weekReadystat / (1800 * 1000)) * 100), 2)
         $Groupedmonthstats = Get-Stat -Entity $vm -Stat $Stattypes -Start (get-date).AddDays(-30) -Finish (get-date) -IntervalMins 120 -Instance "" -ErrorAction SilentlyContinue | Group-Object MetricId
         $monthCPUAverageStat = "{0:N2}" -f $($Groupedmonthstats | Where {$_.Name -eq "cpu.usage.average"} | Select-Object -ExpandProperty Group | Measure-Object -Average Value | Select-Object -ExpandProperty Average)
         $monthCPUUsageMhzStat = "{0:N2}" -f $($Groupedmonthstats | Where {$_.Name -eq "cpu.usagemhz.average"} | Select-Object -ExpandProperty Group | Measure-Object -Average Value | Select-Object -ExpandProperty Average)
         $monthReadystat = $Groupedmonthstats | Where {$_.Name -eq "cpu.ready.summation"} | Select-Object -ExpandProperty Group | Measure-Object -Average Value | Select-Object -ExpandProperty Average
         $monthreadyvalue = [math]::Round($(($monthReadystat / (7200 * 1000)) * 100), 2)
         $Groupedyearstats = Get-Stat -Entity $vm -Stat $Stattypes -Start (get-date).AddDays(-365) -Finish (get-date) -IntervalMins 1440 -Instance "" -ErrorAction SilentlyContinue | Group-Object MetricId
         $yearCPUAverageStat = "{0:N2}" -f $($Groupedyearstats | Where {$_.Name -eq "cpu.usage.average"} | Select-Object -ExpandProperty Group | Measure-Object -Average Value | Select-Object -ExpandProperty Average)
         $yearCPUUsageMhzStat = "{0:N2}" -f $($Groupedyearstats | Where {$_.Name -eq "cpu.usagemhz.average"} | Select-Object -ExpandProperty Group | Measure-Object -Average Value | Select-Object -ExpandProperty Average)
         $yearReadystat = $Groupedyearstats | Where {$_.Name -eq "cpu.ready.summation"} | Select-Object -ExpandProperty Group | Measure-Object -Average Value | Select-Object -ExpandProperty Average
         $yearreadyvalue = [math]::Round($(($yearReadystat / (86400 * 1000)) * 100), 2)
         $data = New-Object psobject
         $data | Add-Member -MemberType NoteProperty -Name VM -Value $vm.name
         $data | Add-Member -MemberType NoteProperty -Name VMTotalCPUs -Value $VMCPUNumCpu
         $data | Add-Member -MemberType NoteProperty -Name VMTotalCPUSockets -Value $VMCPUSockets
         $data | Add-Member -MemberType NoteProperty -Name VMTotalCPUCores -Value $VMCPUCores
         $data | Add-Member -MemberType NoteProperty -Name "RealTime Usage Average%" -Value $RealTimeCPUAverageStat
         $data | Add-Member -MemberType NoteProperty -Name "RealTime Usage Mhz" -Value $RealTimeCPUUsageMhzStat
         $data | Add-Member -MemberType NoteProperty -Name "RealTime Ready%" -Value $RealTimereadyvalue
         $data | Add-Member -MemberType NoteProperty -Name "Day Usage Average%" -Value $dayCPUAverageStat
         $data | Add-Member -MemberType NoteProperty -Name "Day Usage Mhz" -Value $dayCPUUsageMhzStat
         $data | Add-Member -MemberType NoteProperty -Name "Day Ready%" -Value $dayreadyvalue
         $data | Add-Member -MemberType NoteProperty -Name "week Usage Average%" -Value $weekCPUAverageStat
         $data | Add-Member -MemberType NoteProperty -Name "week Usage Mhz" -Value $weekCPUUsageMhzStat
         $data | Add-Member -MemberType NoteProperty -Name "week Ready%" -Value $weekreadyvalue
         $data | Add-Member -MemberType NoteProperty -Name "month Usage Average%" -Value $monthCPUAverageStat
         $data | Add-Member -MemberType NoteProperty -Name "month Usage Mhz" -Value $monthCPUUsageMhzStat
         $data | Add-Member -MemberType NoteProperty -Name "month Ready%" -Value $monthreadyvalue
         $data | Add-Member -MemberType NoteProperty -Name "Year Usage Average%" -Value $yearCPUAverageStat
         $data | Add-Member -MemberType NoteProperty -Name "Year Usage Mhz" -Value $yearCPUUsageMhzStat
         $data | Add-Member -MemberType NoteProperty -Name "Year Ready%" -Value $yearreadyvalue
         $data | Add-Member -MemberType NoteProperty -Name VMHost -Value $esxi.name
         $data | Add-Member -MemberType NoteProperty -Name VMHostCPUSockets -Value $esxiCPUSockets
         $data | Add-Member -MemberType NoteProperty -Name VMHostCPUCores -Value $esxiCPUCores
         $data | Add-Member -MemberType NoteProperty -Name TotalVMhostCPUs -Value $TotalesxiCPUs
         $data
       } #foreach ($vm in $vmlist)
     }#foreach ($esxi in $(Get-VMHost $Name))
   } #process
 } #Function Get-Ready
How to you use this script. Here I will save above command in powershell profile script.
Make sure you have downloaded and installed powercli. Open powercli as a administrator (Demo: how to open powercli). if you see any errors in red regarding execution policy make sure your you are allowed to run PS1 files by running command
Set-ExecutionPolicy RemoteSigned -Confirm:$true
Make note of the location and create the Microsoft.PowerShell_profile.ps1 or run Notepad $profile to create a file at the location (you might also need to create a folder as well if not created earlier)
Save the file, Close Powercli console and open it again.
Connect to vCenter Server. now you are ready to get the report. You have to run below command and output it to CSV file.
This is a personal weblog. The opinions expressed here represent my own and not those of my employer.
While every caution has been taken to
provide my readers with most accurate information and honest analysis,
please use your discretion before taking any decisions based on the
information in this blog. Author will not compensate you in any way
whatsoever if you ever happen to suffer a loss/inconvenience/damage
because of/while making use of information in this blog.
In my one of the blog written long time back Changing network adapter type in VMware some of the users reported after doing VM network adapter type they are not able to retain, below dos command on the windows will be helpful, if you want to retain IPs and apply it through scripting.
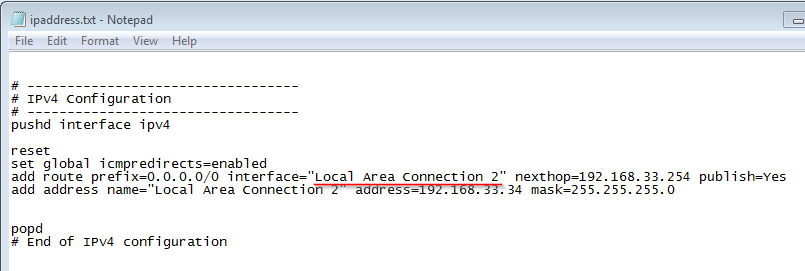
netsh interface ip dump > c:\ipaddress.txt
If you open ipaddress.txt file, you will find below information.
 # ----------------------------------
 # IPv4 Configuration
 # ----------------------------------
 pushd interface ipv4
 reset
 set global icmpredirects=enabled
 add route prefix=0.0.0.0/0 interface="Local Area Connection 2" nexthop=192.168.33.254 publish=Yes
 add address name="Local Area Connection 2" address=192.168.33.34 mask=255.255.255.0
 popd
 # End of IPv4 configuration
you just need to be sure changed new added or modified Network adapter interface name should match.
for restoring IP address information use below command.
This is my first blog in new year 2015 I recently receive query from my colleague on fetching Hot add CPU and Hot add memory feature for all VMs. below is a one liner powercli script which will pull the data in CSV format.
As per VMware's re-certification policy my VCP exam was going to exam in March 2015, on basis it Yesterday I passed VCP5-DCV (VCP550) exam. There are 135 Questions and you get 120 minutes (for non english contry you will get 30 mins extra), I already passed exam on 4.1 and 5.0 version in the past (I am also preparing for for VCAP and VCPC), Now my expiration date is showing in December 2016.
Below were the things helped me to pass exam.
Being vSphere administrator I already have great hands on on VMWare web client., I remember in the current VCP550 exam lots of question are related to it.
Study vCops (vmware operations manager) Major and Minor batches, I found there are 6-7 questions related to it.
I don't have much exposure to vSAN, Fault Tolerance (FT), Flash Read cache (FRC) in my current environment but little labs hands on helped me to clear out these stuffs.
Promotion code VFVCP1450 will help till 19 December 2014 and it has 50% discount. Exam fee is 175 USD and after 50% discount 85.50 USD you will have to pay. And find nearest exam center for Pearson Vue once you register for the exam online on the website.
Today I received weird request from my 2 of my peer colleagues, that they are not able to login to particular vCenter server and getting Cannot complete login due to an incorrect user name or password, when check with other users including me, were able to connect to the vCenter Server successfully without any hiccups, Also if affected users try with same username and password on other vCenter servers it works perfectly and have no trouble.
While isolating I found permissions are in place on affected vCenter server and indeed they are trying with correct username and password. This vCenter is an appliance and running version is 5.0.
When I checked messages log file under /var/log on the vCenter server (used grep command to find username for only related logs) then I found deny messages for affected users only.
After some digging up on VMware kb I stumble upon, KB2008986, it was dictating similar symptom my colleagues were facing.Cannot login to the vCenter Server Appliance using the vSphere Client or vSphere Web Client after joining Active Directory (2008986)
As per the KB this happens because the deny 3 in the /var/log/messages file indicates that a maximum of 3 failed logins have occurred. After 3 failed logins, all subsequent log in attempts are denied. And below is the command to reset it /sbin/pam_tally --user user@domain.com --reset
and after this my colleagues were able to connect to the vcenter successfully without any issue. Regarding pam_tally more information can be found on http://linux.die.net/man/8/pam_tally
After successfully tweaking my VM Inventory script, I had written this VMHost inventory script, which helps me for quick info for Capacity Planning, CPU EVC mode, SSH service status and etc, Below is the full list.
Management IP and its VLAN
Model
ESXi Service Tag/ Serial No
TotalVMs and PowerOn VMs count
Esxi host CPU Sockets and Core per socket
Total ESXi host CPU mhz and Logical CPU
Esxi memory and assigned to VMs
MAX-EVC-Key (This is helpful when setting up EVC mode on the vmware cluster)
ESXi uptime
Domain, syslog and dump collector settings info
DRacIP and RackLocation (You will have to fillup onetime custom attributes (annotation))
Recently I faced some issue with my LAB AD and due to this my vmware infrastructure disturbed. While troubleshooting I came across tool vCenter Appliance called domainjoin-cli located under /opt/likewise/bin folder. With this tool you can manage AD authentication settings from command line. Below are the some of the screenshots how the command works. When you CD to the directory and run this command you will see the standard help and its parameters how to use it.
Below is the query result when computer account for vCenter appliance was deleted from AD. Error: LW_ERROR_KRB5KDC_ERR_C_PRINCIPAL_UNKNOWN [code 0x0000a309] client not found in Kerberos database
To correct this I manually created new computer account in AD (New Computer account SID (Password) is not matching with vCenter server). Which resulted into below error. Error: LW_ERROR_PASSWORD_MISMATCH [code 0x00009c56] The password is incorrect for the given username
And this is the one when my AD server was down Error:LW_ERROR_DOMAIN_IS_OFFLINE [code 0x00009cb9] The domain is offline
You can disjoin vCenter from AD with ./domainjoin-cli leave
This is query status after dis-joining from AD.
When in the last I rejoined it in AD, this the query status (you can use ./domainjoin-cli join command to do the same join this VC in domain.)
Troubleshooting esxi issues using vmkernel and other logs is daily task of vsphere administrator. for this SSH service should be running on esxi server so esxi server can be connected through putty, and in the end of the day if you have company policy in place where they says SSH service should be disable after work is done (I have seen in ICINGA or Nagios monitoring tools if SSH services is enabled it throws alert). It is time consuming when you want to check and stop ssh service on esxi server.
Here this script is handy check the status of SSH service and get report. Check Status of service Get-VMHost | Get-VMHostService | Where-Object {$_.Key -eq 'TSM-SSH'} | Select-Object -Property VMHost, Key, Label, Policy, Running
Check Status of SSH firewall rule it also shows status of service running or not Get-VMHost | Get-VMHostFirewallException | Where-Object {$_.Name -eq "SSH Server"} | Select-Object VMHost, Name, Enabled, IncomingPorts, OutgoingPorts, TCP, ServiceRunning Where running column shows what is the current state of service whether it is running false or true. Another state is policy, there are 3 options to this on, off, automatic. Policy - on: (Start and stop with host):Starts and stops the SSH service when the host powers on or shuts down. Policy - off: (Start and stop manually):Enables manual starting and stopping of the SSH service. Policy - Automatic: (Start and stop with port usage):Starts or stops the SSH service when the SSH client port is enabled or disabled for access in the security profile of the host. How to start (enable) SSH service on esxi hosts before running this script you will need to connect to vcenter or esxi host through powercli before running this script, and once this script executed, you can simply run below cmdlet in the last to start services (you can use this function in your script) Get-VMHost | Start-SSHService
 function Start-SSHService {
   [CmdletBinding()]
  #####################################
  ## http://kunaludapi.blogspot.com
  ## Version: 1
  ## Tested this script on successfully
  ## 1) Powershell v3
  ## 2) Windows 7
  ## 3) vSphere 5.5 (vcenter, esxi, powercli)
  #####################################
  Param (
     [Parameter(Mandatory=$true, ValueFromPipelineByPropertyName=$true, Position=0)]
     [ValidateNotNullOrEmpty()]
     [Alias("Name")]
     [string]$VMHost
   )
   begin {}
   Process {
     $AllServices = Get-VMHostService -VMHost $VMHost
     $SShService = $AllServices | Where-Object {$_.Key -eq 'TSM-SSH'}
     if ($SShService.running -eq $false) {
       $SShService | Start-VMHostService -confirm:$false
     }
     else {
       Write-Host -BackgroundColor DarkGreen -Object "SSH service on $VMHost is already running"
     }
   }
   end {}
 }
 #Get-VMHost | Start-SSHService
How to Stop (disable) SSH service on esxi host Stopping service is similar to starting service. run below commands in the last once below given script or function loaded into memory. Get-VmHost | Stop-SSHService
 function Stop-SSHService {
  #####################################
  ## http://kunaludapi.blogspot.com
  ## Version: 1
  ## Tested this script on successfully
  ## 1) Powershell v3
  ## 2) Windows 7
  ## 3) vSphere 5.5 (vcenter, esxi, powercli)
  #####################################
   [CmdletBinding()]
   Param (
     [Parameter(Mandatory=$true, ValueFromPipelineByPropertyName=$true, Position=0)]
     [ValidateNotNullOrEmpty()]
     [Alias("Name")]
     [string]$VMHost
   )
   begin {}
   Process {
     $AllServices = Get-VMHostService -vmhost $VMHost
     $SShService = $AllServices | Where-Object {$_.Key -eq 'TSM-SSH'}
     if ($SShService.running -eq $true) {
       $SShService | Stop-VMHostService -confirm:$false
     }
     else {
       Write-Host -BackgroundColor darkGreen -Object "SSH service on $VMHost is already stopped"
     }
   }
   end {}
 }
One of x-colleague and good friend of mine called me and said that, recently they are receiving lots of alerts for high memory usage on their monitoring software (Windows and Linux), As they are using some old open source tool currently and it doesn't have capability to tell which process is consuming most of the memory. (It can be monitored through Performance Monitor - Perfmon under Process, This script is just created out of curiosity)
He asked me to write a script to capture top 10 memory consuming processes (for Windows servers) in CSV/XLS file format for creating fancy charts. (Another request was that He should be able to schedule it as they were receiving alerts randomly any time of day or after couple of days for few minutes only, keep watching task manager or resource monitor whole day was very time consuming process and not good for them when meeting SLAs)
below script is useful for the same conditions or can be used as general purpose tool by system administrators.
   <#
   .SYNOPSIS
   PowerShell function to monitor what process is using resources
   .DESCRIPTION
   Includes parameters to monitor server and latecy, and capture data in file.
   .EXAMPLE
   Monitor-ProcessMemoryUsage -IntervalinSeconds 600 -MonitorPeriodHours 1 -File c:\temp\CapturedData.csv
   #>
  #####################################
  ## http://kunaludapi.blogspot.com
  ## Version: 1
  ## Tested this script on successfully
  ## 1) Powershell v4
  ## 2) Windows 7
  ##
  #####################################
   [CmdletBinding()]
     param(
       [Parameter(Mandatory=$False, HelpMessage="Enter Interval in seconds[After how many second you want to capture data]")]
       [alias("Interval","I")]
       [string]$IntervalinSeconds = 300,
       [Parameter(Mandatory=$False, HelpMessage="For how long you want to capture data [in hours]")]
       [alias("Monitor","M")]
       [string]$MonitorPeriodHours = 1,
       [Parameter(Mandatory=$False, HelpMessage="Where you want to store CSV file")]
       [alias("File","F")]
       [string]$FileName = "$env:USERPROFILE\Desktop\$("MemUsage{0}{1}{2}.csv" -f $(Get-Date).day, $(Get-Date).Month, $(Get-Date).Year)"
     )
   begin {
     $FutureTime = [DateTime]::Now.AddHours($MonitorPeriodHours)
     $i=0
   }
   process {
     do {
       $i++
       $TimeNow = [DateTime]::Now
       $AllProcesses = Get-Process -IncludeUserName
       $Processors = Get-WmiObject -Namespace root\CIMv2 -Class win32_processor | Select-Object -ExpandProperty NumberOfLogicalProcessors
       $SortedMemory = $AllProcesses | Sort-Object PM -Descending
       $TopMemory = $SortedMemory | Select-Object -First 10 -Property @{l="Number"; e={$i}}, @{l="Time"; e={$TimeNow}}, Name, Description, Path, Id, StartTime, @{l="Private Memory (MB)"; e={[Math]::Round($($_.PM / 1mb),2)}}, UserName
       $TopMemory | Export-Csv -NoTypeInformation -Path $FileName -Append
       Start-Sleep -Seconds $IntervalinSeconds
     }
     While ([DateTime]::Now -lt $FutureTime)
   }
   end {}
How does this script works? Get-Process is the the main cmdlet will pull the required data. You will have to copy paste script in notepad and save it as ps1 extension file. In my scenario I named it Monitor-ProcessMemoryUsage.ps1 and saved it in c:\temp folder location Open powershell (run as administrator), change directory path to the location where ps1, script is stored and run the the ps1 file as above screenshot, there are some of the parameters associated (if you dont provide any parameters and just run the script with .\monitor-processmemoryusage.ps1 it will take below values by default)
-IntervalinSeconds After how many seconds you want to monitor and store process memory usage in file., if you dont provide this value it will take 300 seconds means after every 5 min it will store data. -MonitorPeriodHours For how hours data will be keep collecting default value is 1 hour. -FileName filename and Location of csv file, by default it keep file on your desktop. Once you received data you can manipulate it in excel and after filtering and other stuff you can pull cool Chart or graph reports.
Today I wanted to change DNS settings on esxi server through VMware web client, and as usual I went to esxi configuration tab, under Software panel. but boom, DNS and routing settings were missing, After checking vSphere client I was confirmed that I am trying to find out DNS and Routing under correct tab and location.
After some digging up I was able to locate it on VMware web client. Now it is under esxi server tab Manage>Networking and the name has been changed to TCP/IP stack configuration.
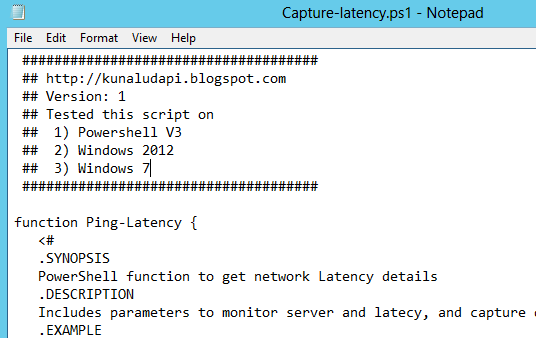
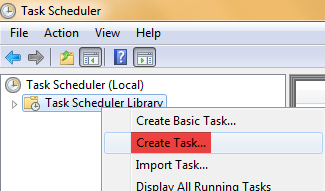
Back in old days I used to schedule DOS batch files a lot with windows task scheduler, same way we can schedule Powershell PS1 script. For example purpose I am using my earlier script here as a demo monitor ping latency and drops, (for parameters check the blog) I have copied script code in notepad and saved it as a PS1 extension at location c:\temp\capture-latency.ps1. In this ps1 file in the last I added mentioned function and its parameter Computer (-c), Latency (-L), Hours (-H), Filename (F). Open task scheduler. Right click Task Scheduler library and Create new task.
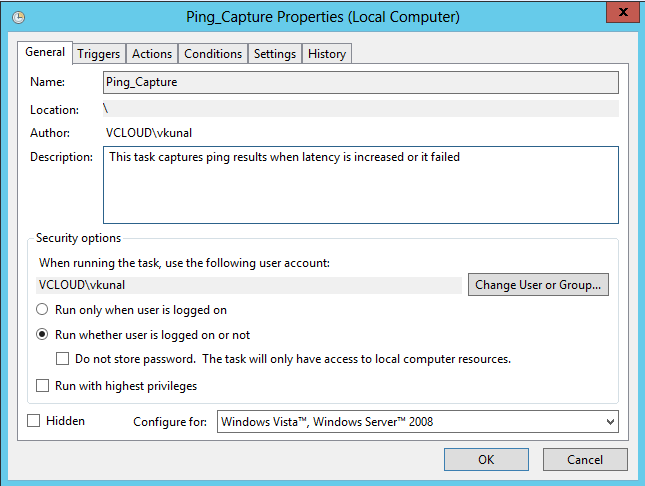
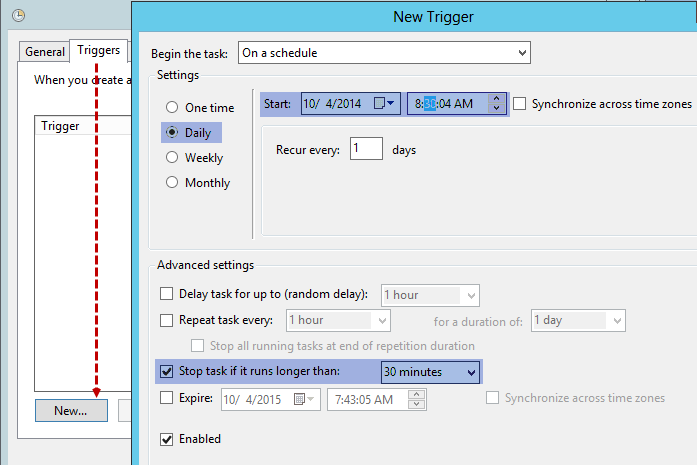
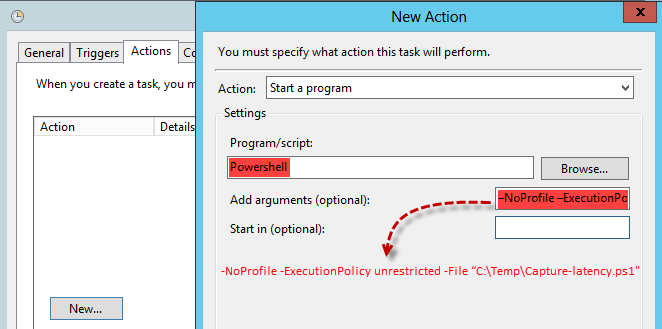
Here I have given what time this task will trigger, example 8:30 AM is a login time of all user and I want to capture details for next 30 min or 1 hours, This is the time when all users login onto Terminal Servers., and load get increased Powershell (Program/Script) will be running with, and below parameters (Add arguments).
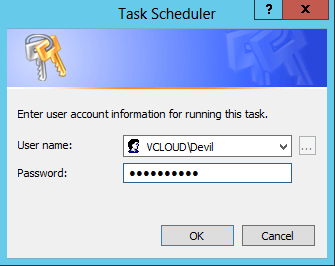
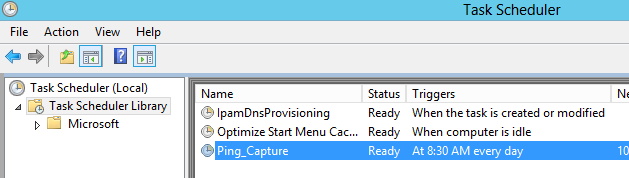
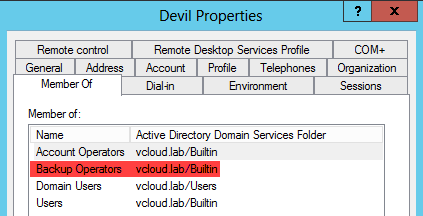
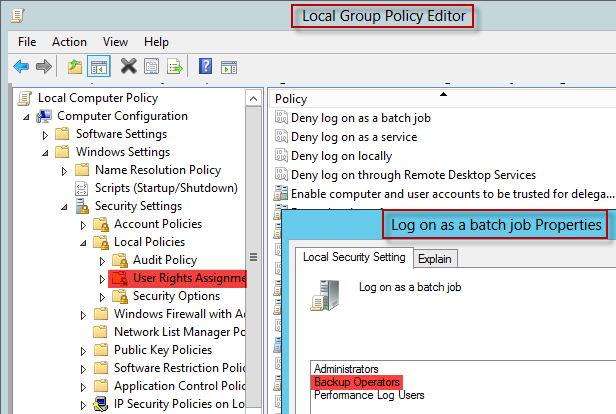
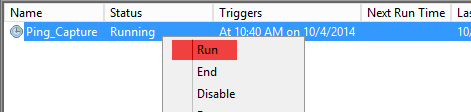
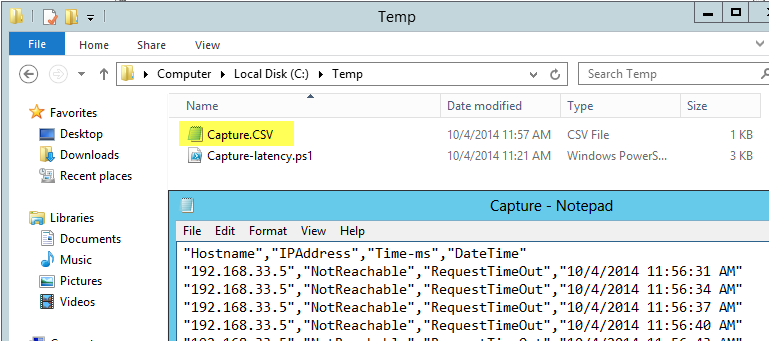
-NoProfile -ExecutionPolicy unrestricted -File "C:\Temp\Capture-latency.ps1" Once done and clicking on will ask for the user credentials by on what user behalf this task need to be run, you should know password for the same user. You will see the task just you created. After creating task it gave warning that user should be have permissions to log on as batch job, for this I added same user in Backup Operators group to ensure he will get correct rights. As the below screenshot you can locate same settings in GPEDIT.MSC. (This is just a demo here there are other best ways to provide users this permission) To test the job you can right click and Run it, you will see csv file generated under c:\temp\folder You can end the task by right clicking job., and verify the CSV file, if you find it is successful, you are ready to wait for next schedule to start this job. Powershell Ping multiple IP addresses Capture ping Latency or drops results with powershell - Part1 Capture multiple IP Latency or drops results with powershell Test-Connection - Part 2 Schedule PowerShell (.PS1 file) script in Windows Task Scheduler - Part 3